Custom Data-Derived Products
Several examples of data-derived products are shown below. These, and others, for any desired parameter, station, and time period, are available upon request. Please contact Dr. Sytske Kimball (skimball@southalabama.edu) for further information.
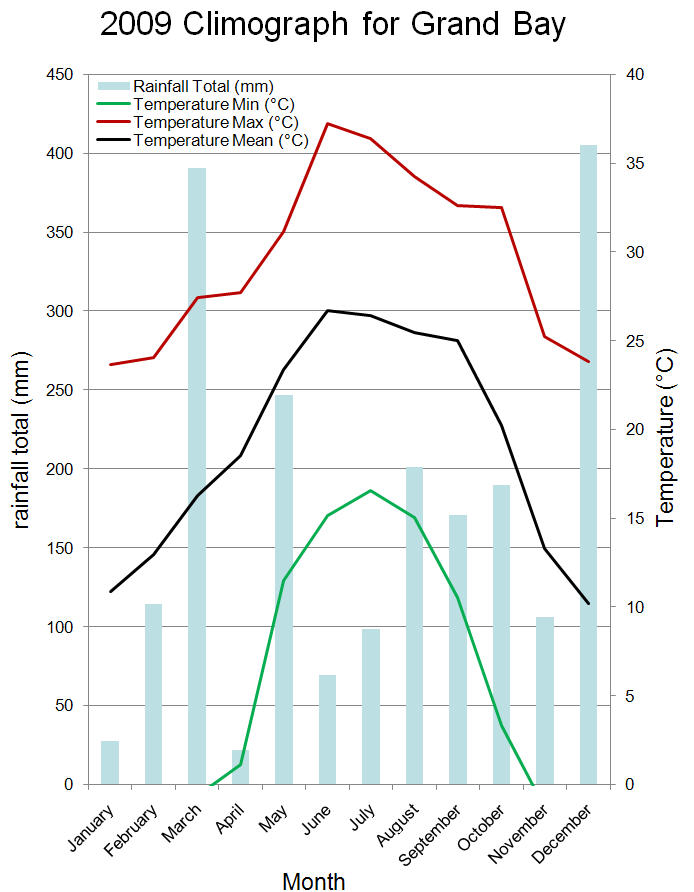
Climographs
A climograph shows rainfall totals and temperatures (minimum, maximum, average) of a site for every month of the year. This can be for one or more years. For climatological purposes usually 20 to 30 years are used. However, a climograph for a particular year is useful because it can visually be compared to the climatological mean of the 20 or 30 year climograph. This way you can tell if a wet or dry, warm or cold year occurred.
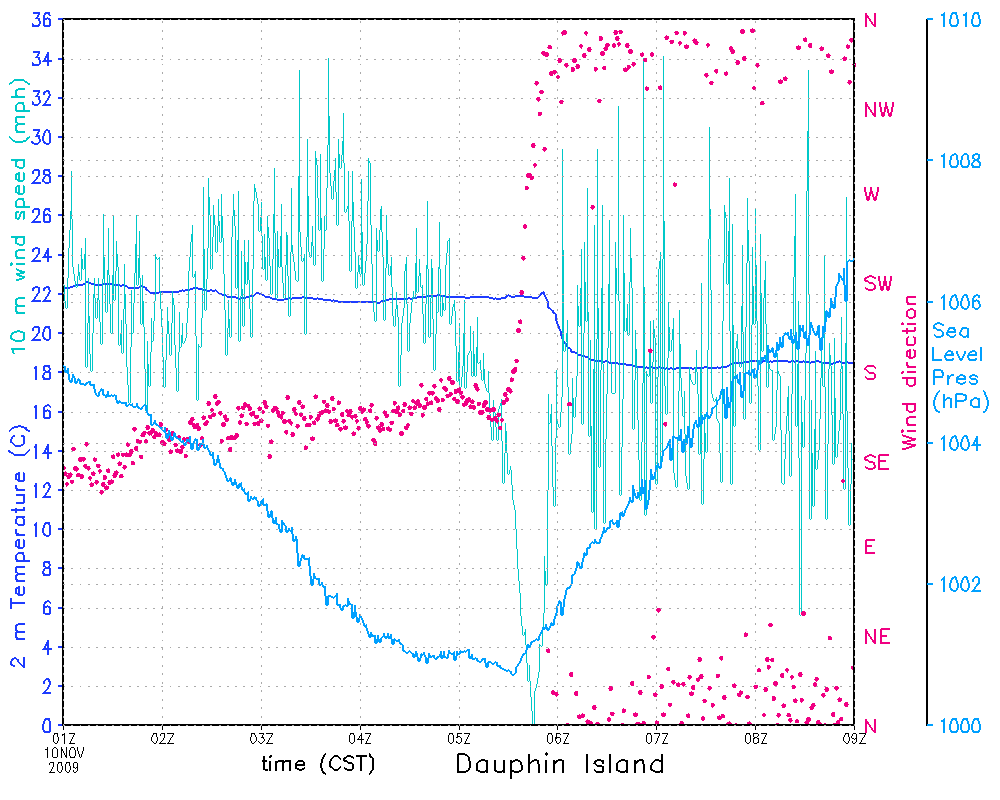
Time Series
Time series plots graphically show the evolution of certain measured parameters. In the example above, the atmospheric pressure (light blue line), temperature (dark blue line), wind speed (turquoise line), and wind direction (pink dots) are shown for when Hurricane Ida's (2009) center (or eye) crossed the Mesonet station on Dauphin Island. As the storm center approached, the pressure gradually dropped, and reached a minimum just before 06:00 CST. This is when the center was right over the station. Also typical of hurricane centers are that the wind speeds are close to zero and the wind changes direction. All this can clearly be seen in the time series graph. Time series plots can be made for any combination of parameters or for one parameter but for several stations. Any length of time can be used, from several hours to several years. This way fluctuations and trends quickly become obvious and occurrences of extreme events can be pinpointed to a specific time.
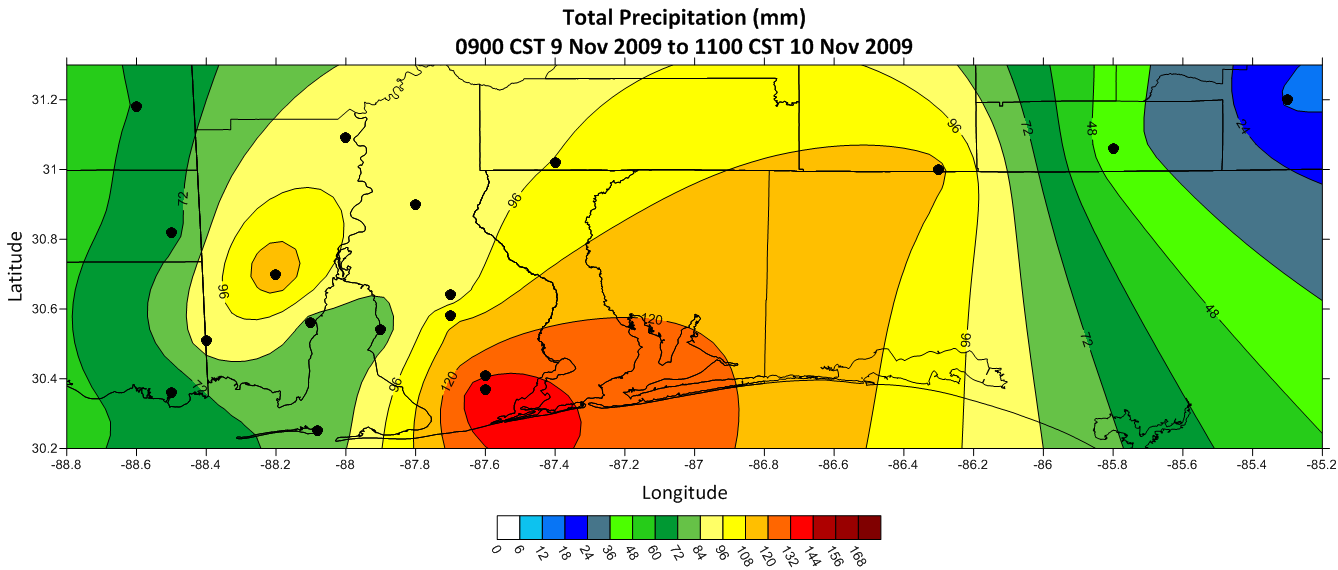
Maps
Contoured maps show the spatial distribution of one or more variables over a given period of time. The example shown above displays the total amount of rainfall that had fallen after Hurricane Ida (2009) moved across the Mesonet area. Black dots indicate the locations of the Mesonet sites. Contoured maps allow a user to see where maximum or minimum values of rainfall, windspeed, temperature and any other desired parameter occurred.
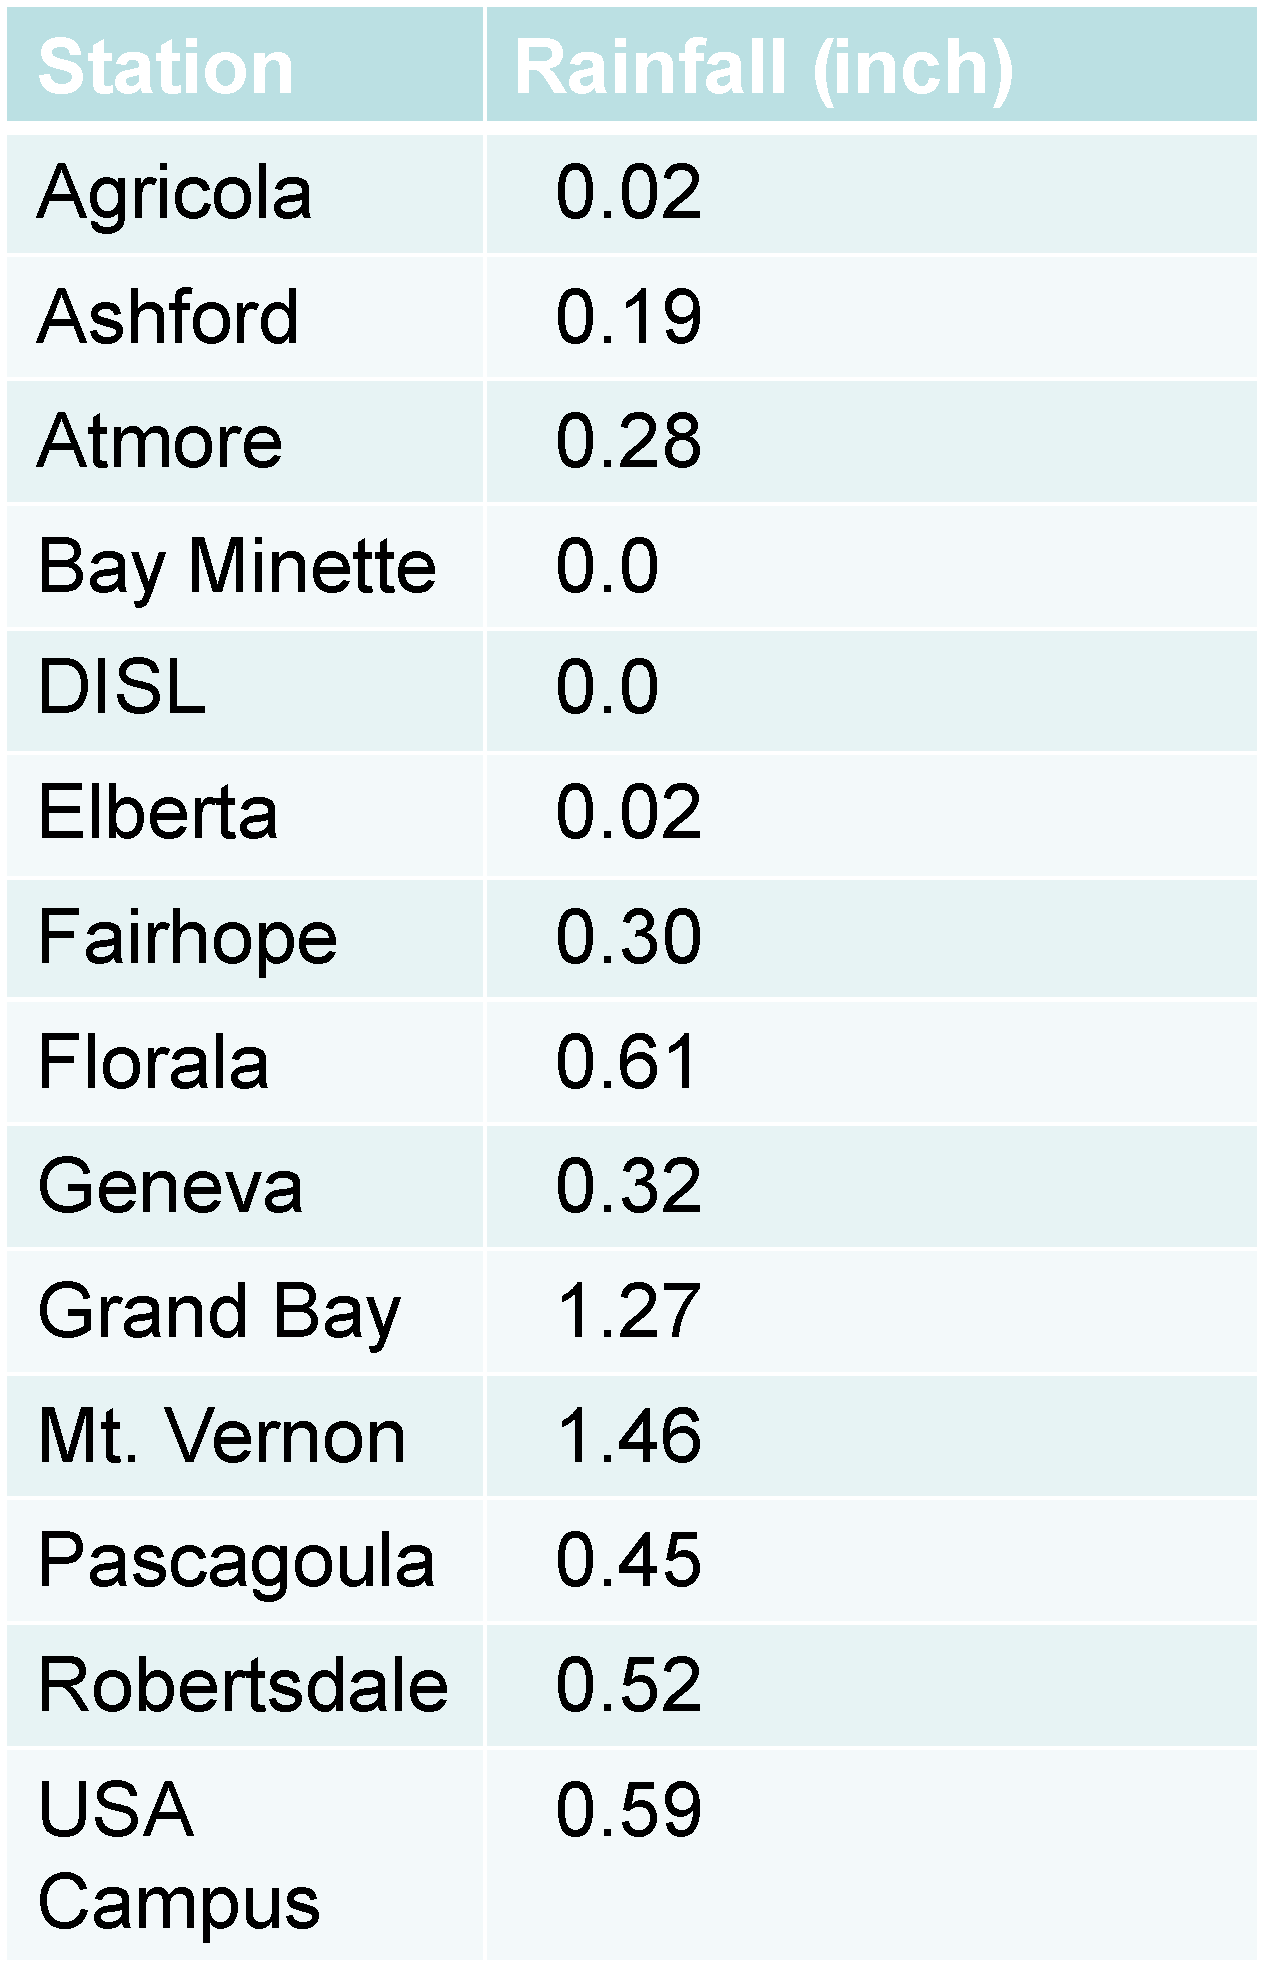
Tables
Tables summarizing any parameter or derived (calculated) parameter can be produced. Examples include rainfall totals at different locations for a given event such as a tropical storm, annual rainfall totals for different locations, minimum and maximum monthly temperatures for one given location. Tables give numerical values for exact comparisons, whereas graphs allow relative comparisons over time or space.